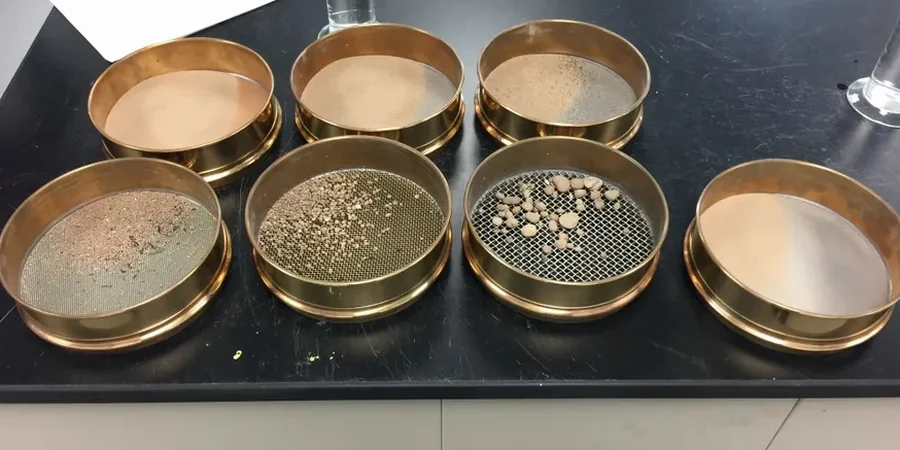
The sieve stack stands ready in the lab, a column of brass frames with mesh apertures ranging from 75 mm down to 63 microns, each ring machined to tolerances that define the boundary between gravel, sand, and silt. For fine-grained fractions that pass the No. 200 sieve, the hydrometer cylinder takes over: a 1000 ml graduated glass vessel where Stokes' law governs the sedimentation of particles through an aqueous suspension over a 24-hour reading schedule. Our Aberdeen laboratory runs both procedures as a single, integrated particle size distribution workflow, calibrated against the requirements of BS 5930:2015+A1:2020 and the classification framework of BS EN ISO 14688. Specimens arrive from construction sites across the city, from the decomposed granite of the Rubislaw area to the glaciofluvial deposits that underlie the harbourfront, and each one passes through the same disciplined sequence: oven-drying, mechanical splitting, washing over the 63 μm sieve, and then the parallel paths of dry sieving for the coarse fraction and hydrometer sedimentation for the fines.
A single grain size curve defines how water moves through a soil, how it compacts under load, and how it will behave when frozen: three questions that every Aberdeen foundation must answer.
Our approach and scope
Site-specific factors
In Aberdeen, we see a recurring pattern where contractors assume that a soil is free-draining based on a quick field inspection, only to discover during the first wet winter that the fine content is far higher than expected. A particle size distribution that shows 15% silt and clay can reduce permeability by two orders of magnitude compared to a clean sand, and that shift is enough to turn a temporary excavation into a sump. The hydrometer curve is the part of the report that gets skipped most often, yet it is precisely the segment that reveals whether a soil will generate pore water pressure under cyclic loading or whether a drainage layer will clog within three seasons. The BS 5930 classification ties directly to the frost susceptibility rating, and in a city where the mean minimum winter temperature dips below zero for four months of the year, ignoring the fines fraction means accepting a heave risk that could lift a lightly loaded slab by 40 mm. We run the sedimentation analysis to its full 24-hour endpoint because the fraction below 2 μm, the true clay content, governs the plasticity and the long-term volume change behaviour that no amount of compaction can eliminate.
Regulatory framework
BS 5930:2015+A1:2020 Code of practice for ground investigations, BS EN ISO 17892-4:2016 Geotechnical investigation and testing — Laboratory testing of soil — Part 4: Determination of particle size distribution, Eurocode 7: BS EN 1997-2:2007 Ground investigation and testing, BS EN ISO 14688-1:2018 Identification and classification of soil, BS 1377-2:1990 Methods of test for soils for civil engineering purposes — Classification tests
Complementary services
Full Sieve Analysis (Coarse and Fine)
Mechanical dry sieving through a stack of BS 410 compliant sieves covering the range from 75 mm to 63 μm. We wash specimens over the 63 μm sieve prior to drying to ensure fines are not lost as dust, and we report the mass retained on each sieve to 0.1 g resolution. The output includes the full grading table, the particle size distribution curve, and the calculated uniformity and curvature coefficients.
Hydrometer Sedimentation Analysis
For the fraction passing the 63 μm sieve, we apply the hydrometer method based on Stokes' law, using a 152H hydrometer in a temperature-controlled sedimentation cylinder. Readings are taken over a 24-hour period with corrections applied for meniscus, temperature, and dispersant concentration. The resulting curve plots particle diameter from 75 μm down to approximately 0.5 μm.
Combined Grading Report with Engineering Classification
We merge the sieve and hydrometer data into a single continuous grading curve and classify the soil according to BS EN ISO 14688-1 and the BS 5930 descriptive system. The report includes D10, D30, and D60 values, the coefficient of uniformity (Cu), the coefficient of curvature (Cc), and the percentage breakdown by gravel, sand, silt, and clay fractions, ready for direct input into geotechnical design calculations.
Typical parameters
Common questions
How much does a sieve and hydrometer particle size analysis cost in Aberdeen?
A combined sieve analysis with hydrometer sedimentation test typically costs between £80 and £150 per sample, depending on the number of specimens and whether the soil requires special preparation such as organic matter removal or carbonate content determination. We provide a firm quote after reviewing the sample condition and the required reporting format.
How long does it take to get results from a grain size test?
Standard turnaround is five to seven working days from sample receipt. The hydrometer portion alone requires a minimum of 24 hours for the full sedimentation reading schedule, and the preceding sieve analysis adds oven-drying time, washing, and mechanical shaking. We can expedite to three working days for urgent projects when advance notice is given.
What is the difference between wet sieving and dry sieving?
Dry sieving passes oven-dried soil through the sieve stack using a mechanical shaker, but it can underestimate the fine content because silt and clay particles adhere to larger grains or escape as airborne dust. Wet sieving washes the sample over the 63 μm sieve first, removing the fines before drying and dry-sieving the retained coarse fraction. BS 5930 recommends wet preparation whenever the soil contains more than a trace of silt or clay, and we apply this as standard for all Aberdeen samples.
Why does a foundation design need both sieve and hydrometer results?
The sieve analysis characterises the sand and gravel fractions that control friction angle and drainage behaviour, but the hydrometer analysis is the only way to quantify the silt and clay content that governs cohesion, compressibility, frost susceptibility, and long-term settlement. A grading curve that stops at 63 μm, the limit of standard sieving, leaves the engineer blind to the most reactive portion of the soil. Eurocode 7 requires the full particle size distribution for any soil where the fines content exceeds 10%, which covers the majority of Aberdeen's glacial and alluvial deposits. More info.